
Charts
BraDypUS can generate charts from the data in any table. Charts are private to their creator by default and can be shared with all users of the application (see Sharing and access).
Open the Charts entry in the main menu to see every chart available to you, run one, or create a new one — it's a full page of its own, not a panel tucked inside a table view.
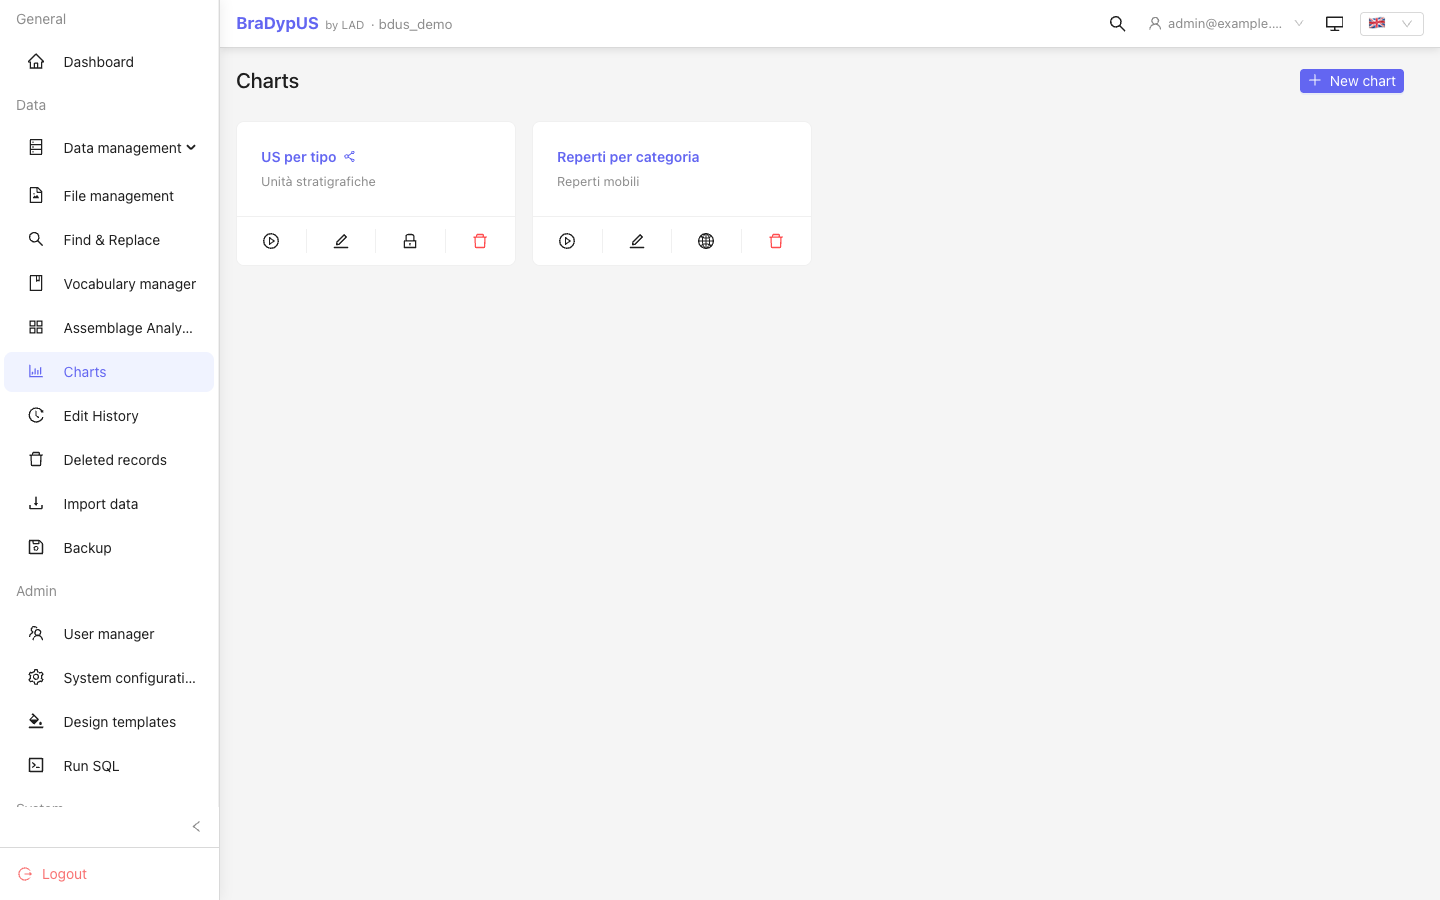
To run a chart full-width, click its name or the ▶ (Run query) button on its card. Owners get three extra actions on their own charts: edit, share/unshare, and delete.
Every view has its own address, so a chart can be bookmarked or linked to directly, a page reload keeps you where you were, and the browser's back and forward buttons work as expected:
| Page | Address |
|---|---|
| Chart list | /{app}/charts |
| A chart, run full-width | /{app}/charts/{id} |
| Editing a chart | /{app}/charts/{id}/edit |
| Creating a chart | /{app}/charts/new |
Creating a chart
Click New chart and pick a table, then configure the chart itself:
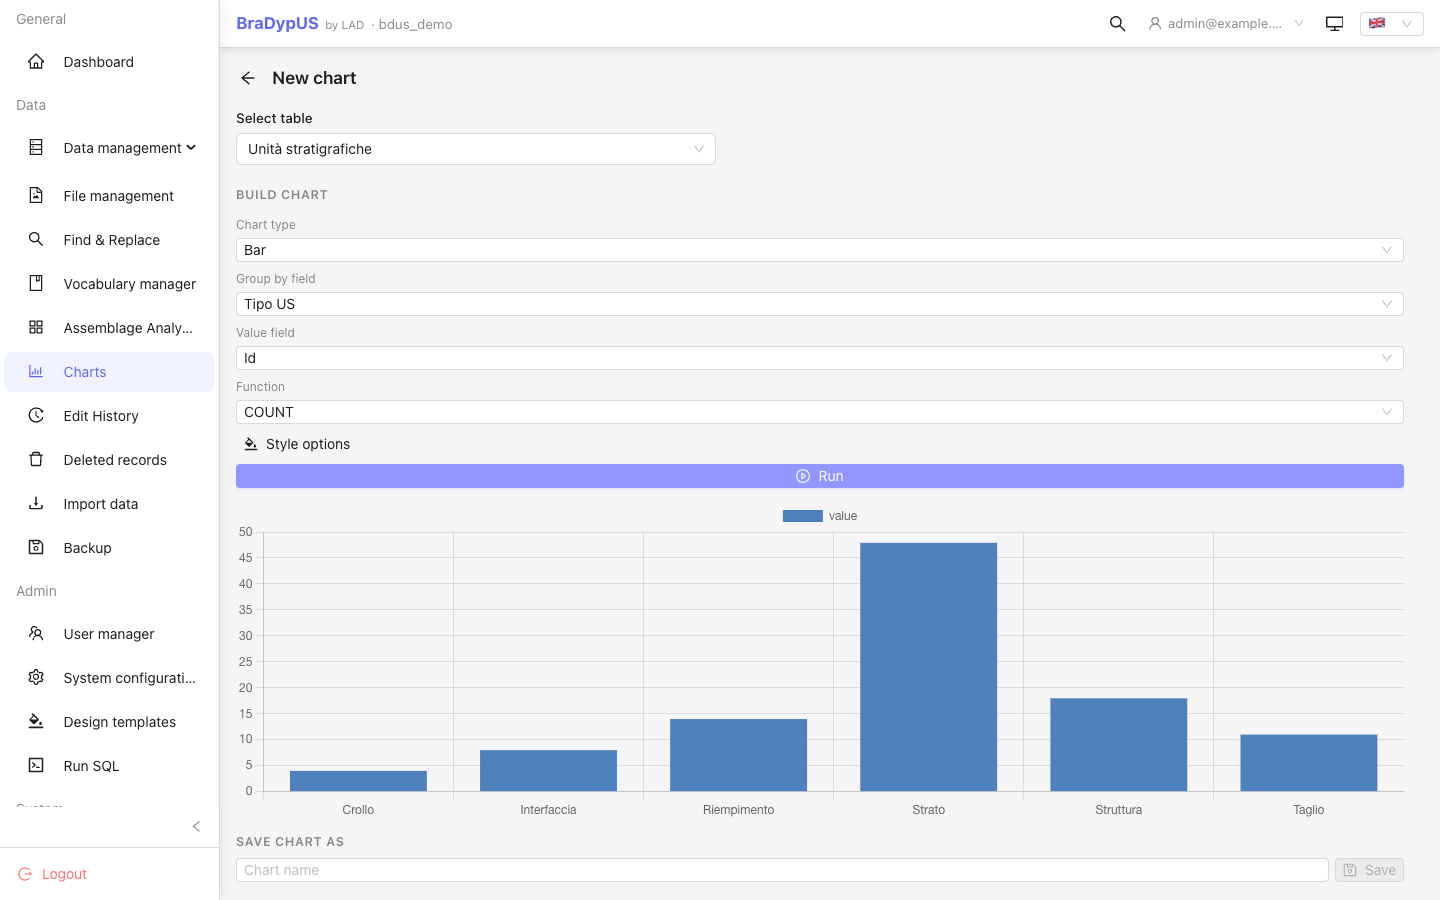
| Field | Description |
|---|---|
| Chart type | bar, line, pie, doughnut, or metric (single number) |
| Group by field | The field to group by (horizontal axis / pie segments) — hidden for metric |
| Value field | The field to aggregate |
| Function | Aggregation: COUNT, COUNT DISTINCT, SUM, AVG, MIN, MAX |
Style options (collapsible) let you set a custom color, legend position, horizontal bars, Y-axis min/max, and decimal places.
Click Run to preview the chart against the live data, then give it a name and click Save.
Filtering a chart
The wizard itself doesn't build filters — a chart's table is fixed once created, and picking a filter from scratch there would just duplicate DataView's own search UI. Instead, build the filter where you already build every other search: open the table in Data management, run a Builder or SQL search from Filters, then click the chart icon (Create chart from this view) in the search toolbar (or in the ⋯ menu on a small screen). A plain text search is not carried over to the chart: use the Builder to make a search a chart can start from.
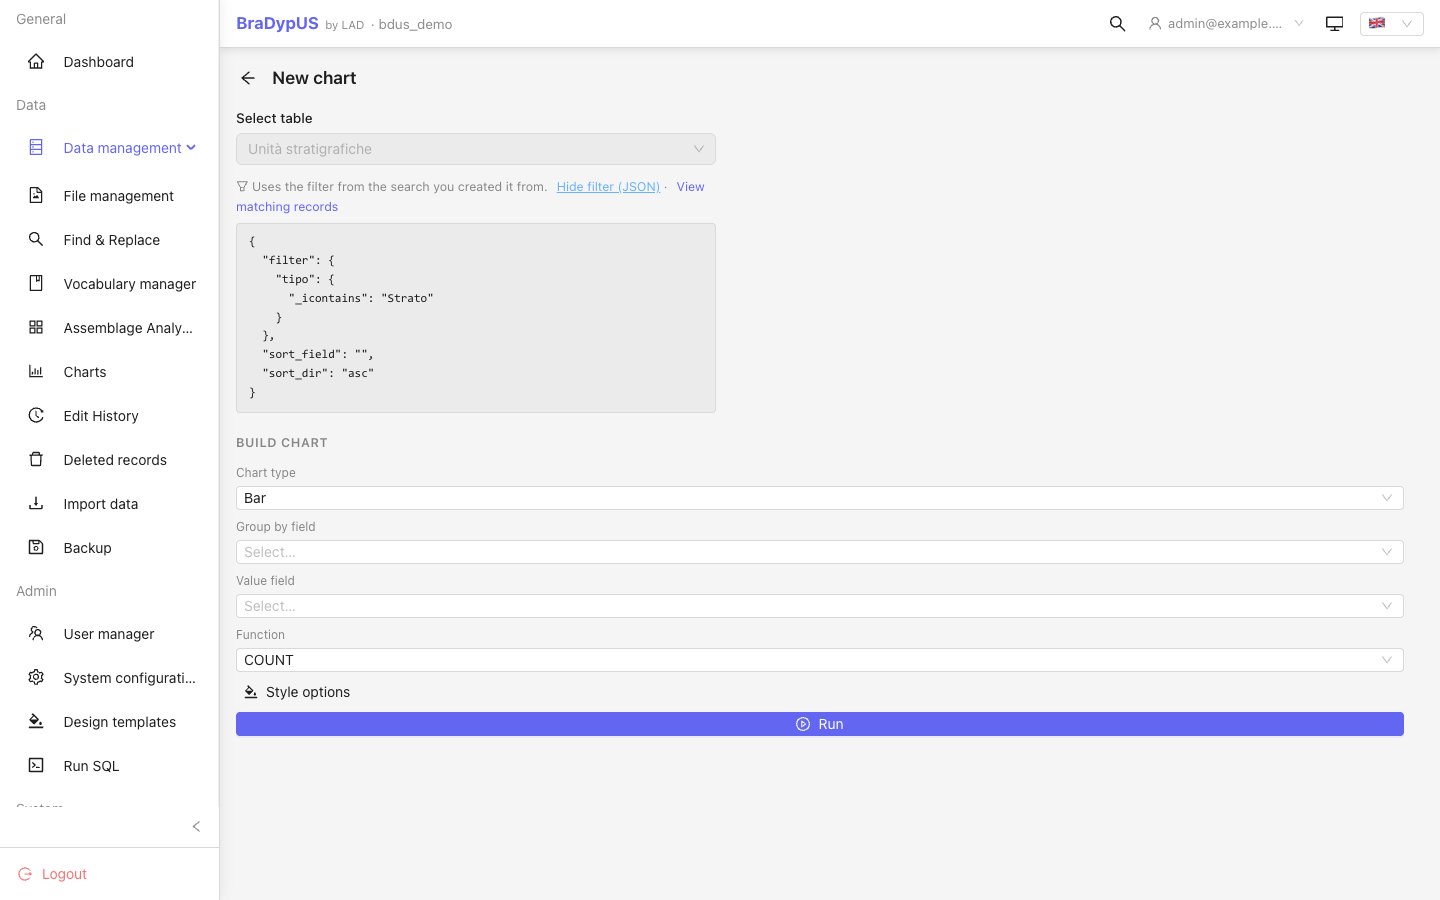
The wizard opens pre-filled: the table is locked (it's implied by the search you came from) and a note confirms the chart will run against that same filter. Everything else — type, fields, style — works exactly as for an unfiltered chart. A chart created this way keeps its filter for good; to change it, create a new chart from a different search rather than editing the filter in place.
Because the filter is not editable, the wizard lets you check exactly what it does. Next to the note (and again when you later edit the saved chart):
- Show filter (JSON) reveals the filter itself, as stored with the chart (Hide filter (JSON) collapses it again);
- View matching records opens Data management, in a new tab, with the same filter applied, so you can see the records the chart is built from.
A chart created without an active search (or via the plain New chart button) runs over every row of its table.
Viewing a chart
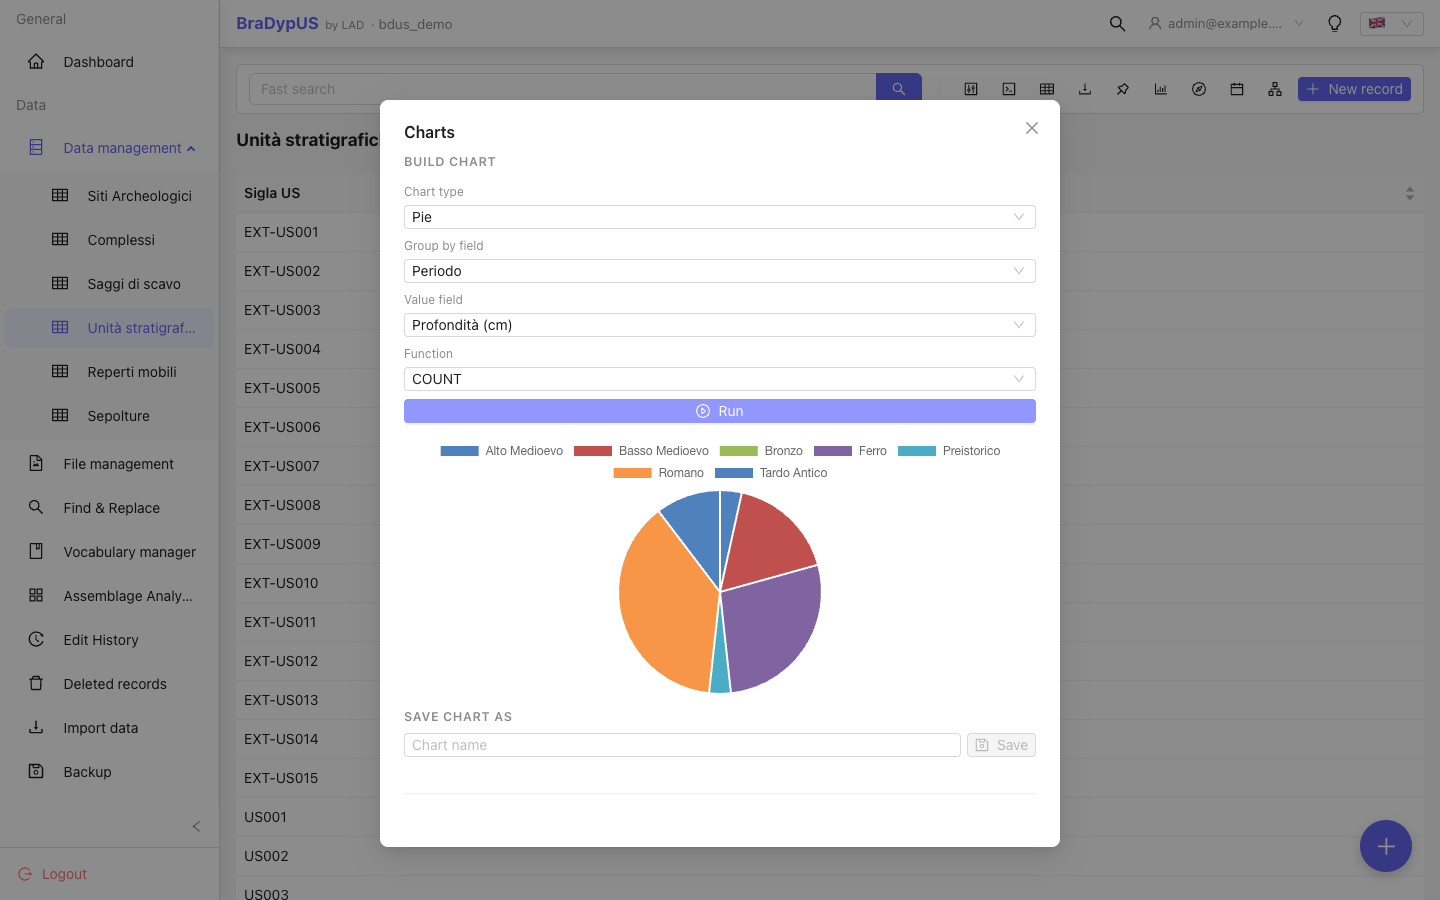
The chart reflects the live data and its own filter (if any) every time it runs — nothing is cached from when it was saved.
Sharing and access
A new chart is private: only its creator sees it in the list. The owner can share it with all users of the application and unshare it at any time, using the toggle on the chart's card: a globe icon (Share) on a private chart, a lock icon (Stop sharing) on a shared one. Shared charts are marked with a share icon next to their name in the list and can be run by anyone, but edited or deleted only by their owner.
Editing and deleting a chart
Click the pencil icon on a chart you own to reopen the wizard, pre-filled with its current name, type, fields, and style — everything except the table and filter, which stay fixed from creation. Click the trash icon and confirm to remove a chart's definition; no record data is ever affected.