
Geodata & GeoFace
BraDypUS stores geographic coordinates (points, polygons, lines) for records that have geodata configured, and displays them on an interactive map via the GeoFace module.
Enabling geodata for a table
Geodata is not a regular field: it is enabled per table. In Config → Tables, open the table and turn on the Geodata (geographic coordinates) switch. Once enabled, records of that table get a Geographic data section in the record view (see Adding and editing geodata on a record) and their geometries appear on the GeoFace map.
Geodata can be imported from GeoJSON (see Import data).
The GeoFace map
Open GeoFace from the sidebar to see all geolocated records on an interactive map (MapLibre GL JS).
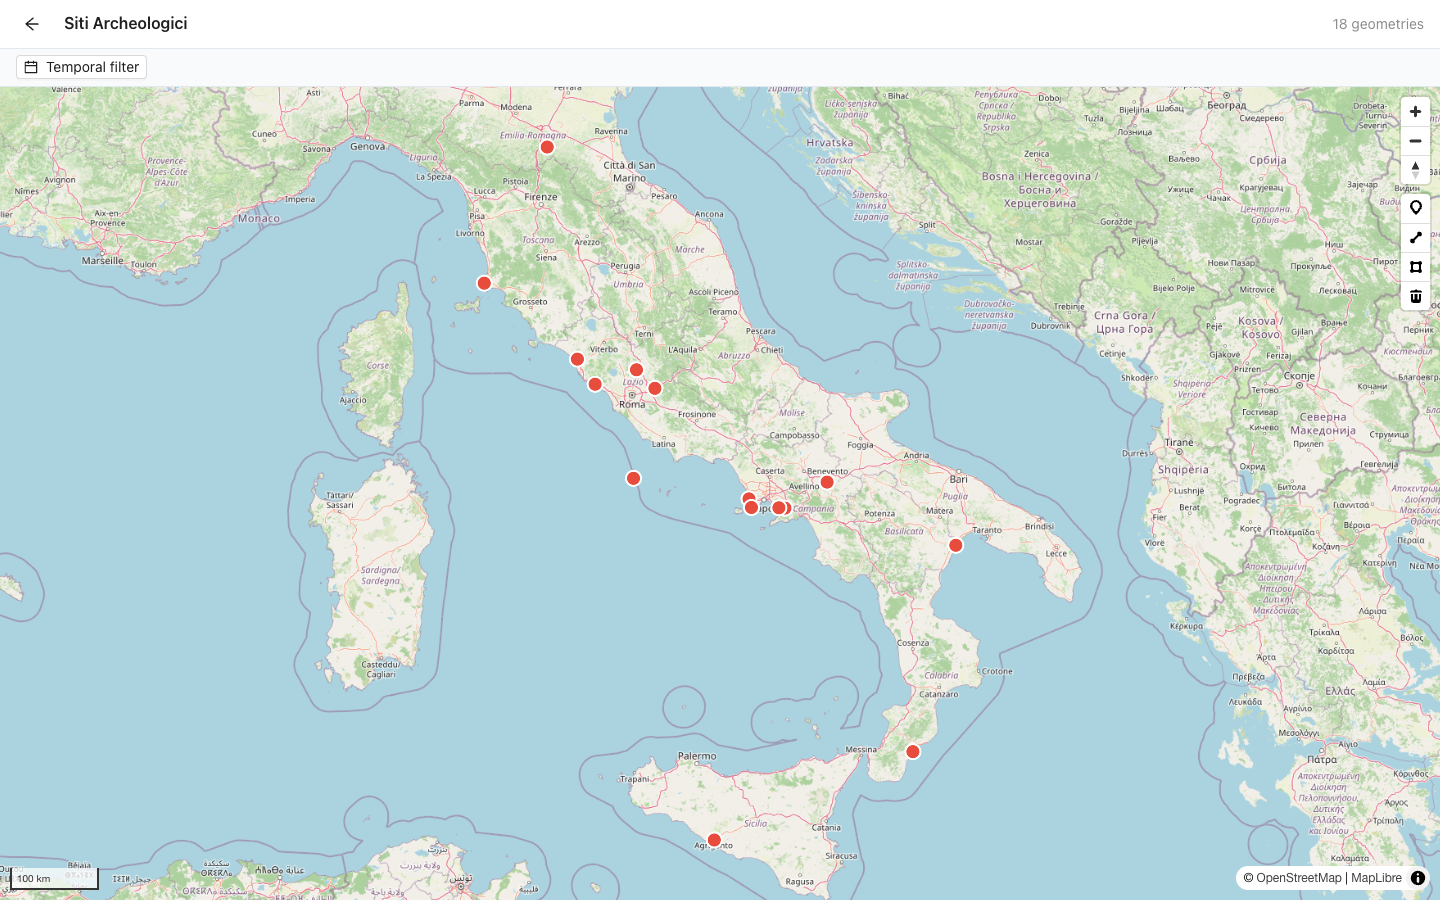
- Points, lines and polygons are rendered from the stored WKT geometries.
- Click a feature to open a popup with the record's preview fields and an Open record link that takes you to the record's read view.
- The active DataView filter is inherited — only filtered records appear on the map.
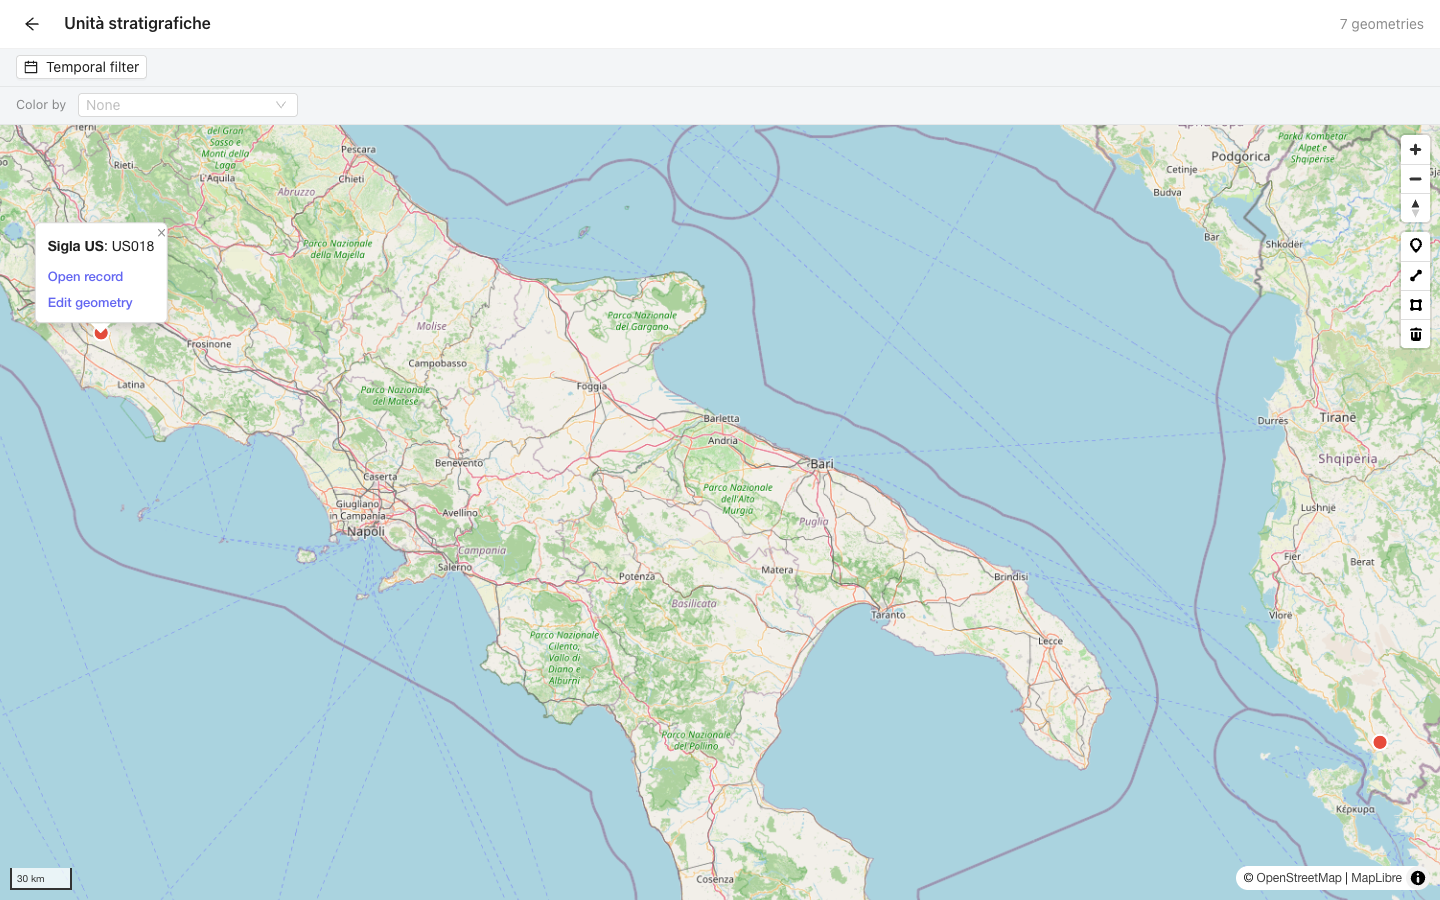
Temporal filter
When the table also has the fuzzy-date plugin active, GeoFace shows a Temporal filter bar above the map with a dual-handle year slider (range −3000 to 2000, step 25 years). Dragging the handles filters the markers in real time, keeping every record whose chronological window intersects the selected years — including open-ended ante quem and post quem records (it uses the _chrono_overlap operator internally).
Coloring geometries by field value
The Color by dropdown above the map lets you theme every geometry by the value of one field of the table, instead of the default flat color:
- Categorical fields (text, vocabulary, select…) get a distinct color per unique value, with a legend listing each value and its swatch. Datasets with many unique values only show the 12 most frequent ones individually — everything else (including records with no value at all) is grouped into a single Other entry.
- Numeric fields get a continuous color gradient from the lowest to the highest value in the current view, with a gradient bar legend showing the range.
- Whether a field is treated as categorical or numeric is detected automatically from the values actually returned — there is no need to mark a field as "numeric" in its configuration.
- Fields that reference another table (a foreign key) are not offered in the dropdown — coloring by a raw internal id wouldn't be meaningful.
If you have edit rights on the table, your choice is remembered as the table's default and applied automatically the next time anyone opens this map; pick None to go back to the default flat color.
Configuring map layers
Open Config → Geoface to add or edit map layers.
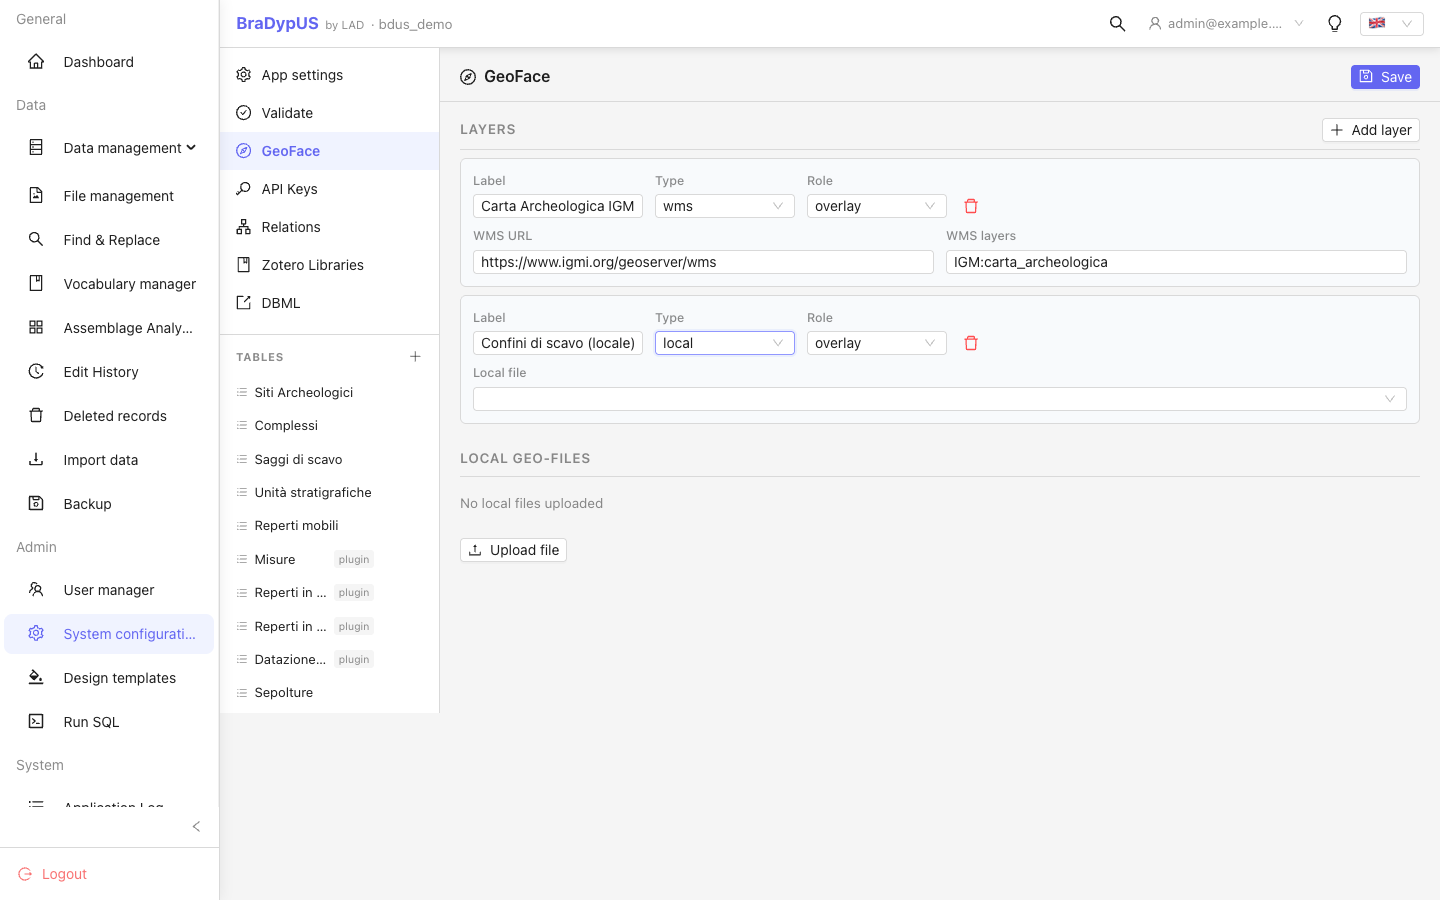
Supported layer types:
| Type | Description |
|---|---|
| WMS | OGC Web Map Service — raster tiles |
| WFS | OGC Web Feature Service — vector features |
| Local file | GeoJSON or KML file uploaded to the server (projects/{app}/geodata/) |
For each layer configure:
| Property | Description |
|---|---|
| Label | Display name shown in the layer switcher |
| URL | Service endpoint or local file path |
| Layer | Layer name (WMS/WFS) |
| Attribution | Copyright/attribution text shown on the map |
| Visible by default | Whether the layer is on when the map opens |
Editing geometries on the map
If you have edit rights on the table, the map also lets you create and change geometries directly. The drawing toolbar (point, line, polygon and trash buttons) and the Edit geometry popup link described below are only shown to users with edit rights, and the server checks the same permission again on every write, so they cannot be used by anyone else.
Drawing a new geometry. Pick a drawing tool and draw on the map. When you finish, a Link geometry to record dialog asks which record the new geometry belongs to: search for it and select it to save.
Moving or reshaping an existing geometry. Click a feature and choose Edit geometry in its popup:
- a point can be dragged as a whole to a new position;
- for a line or polygon, every vertex becomes individually draggable.
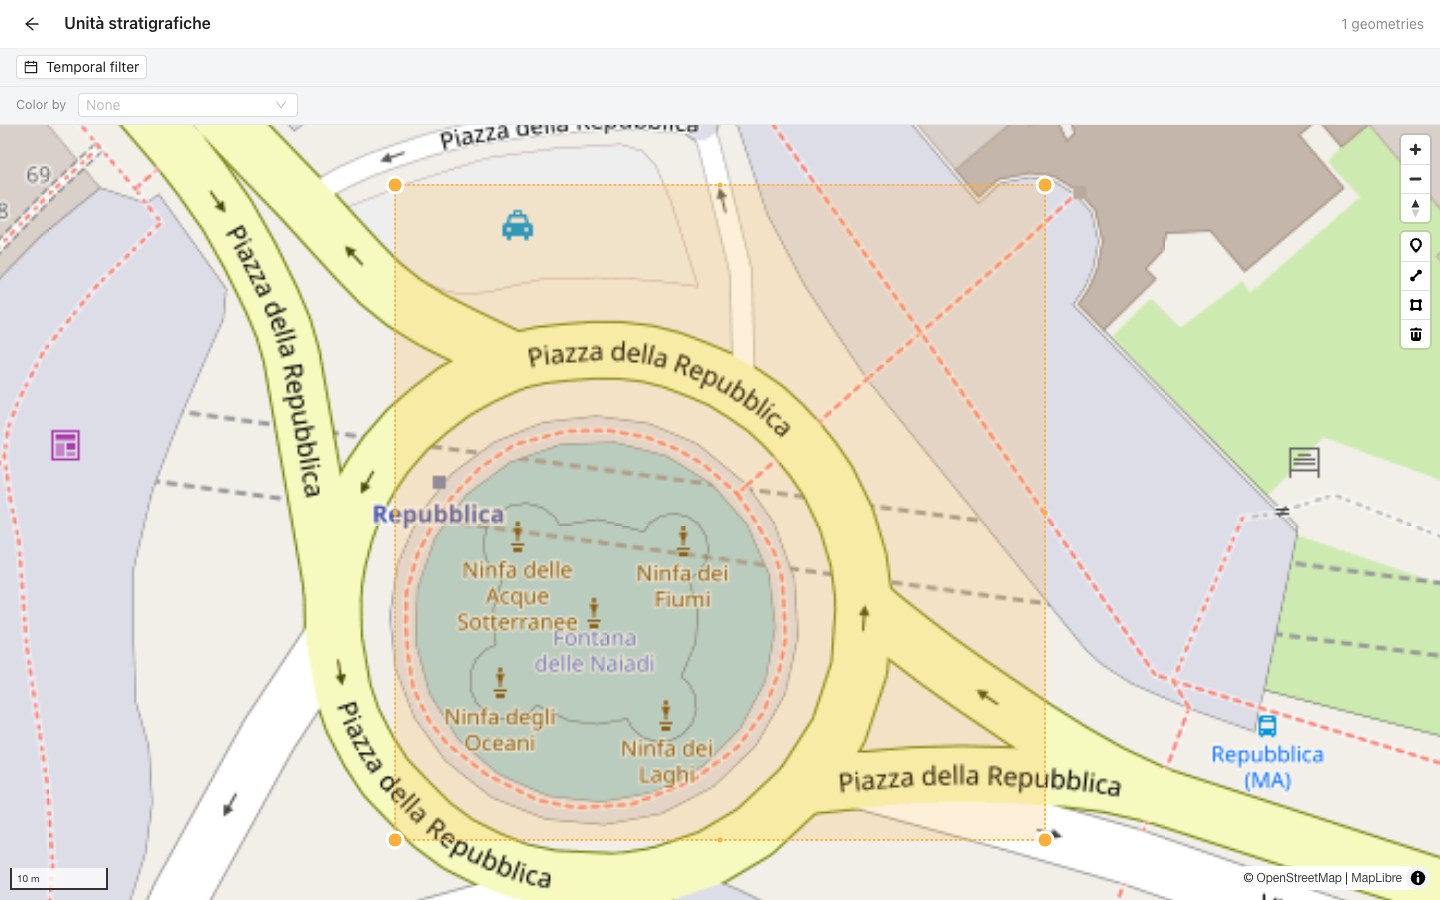
The change is saved as soon as you release the mouse — there is no separate Save button — and a confirmation message appears. Press Esc or click an empty area of the map to leave edit mode without changing anything.
Adding and editing geodata on a record
Geometries can also be edited from the record itself, without opening the map. In the record view, the Geographic data section lists every geometry linked to the record as its WKT text, for example POINT (12.4964 41.9028) (longitude first, then latitude). This is handy for pasting coordinates copied from a GPS device or another tool. In read mode the text is read-only; in edit mode you can:
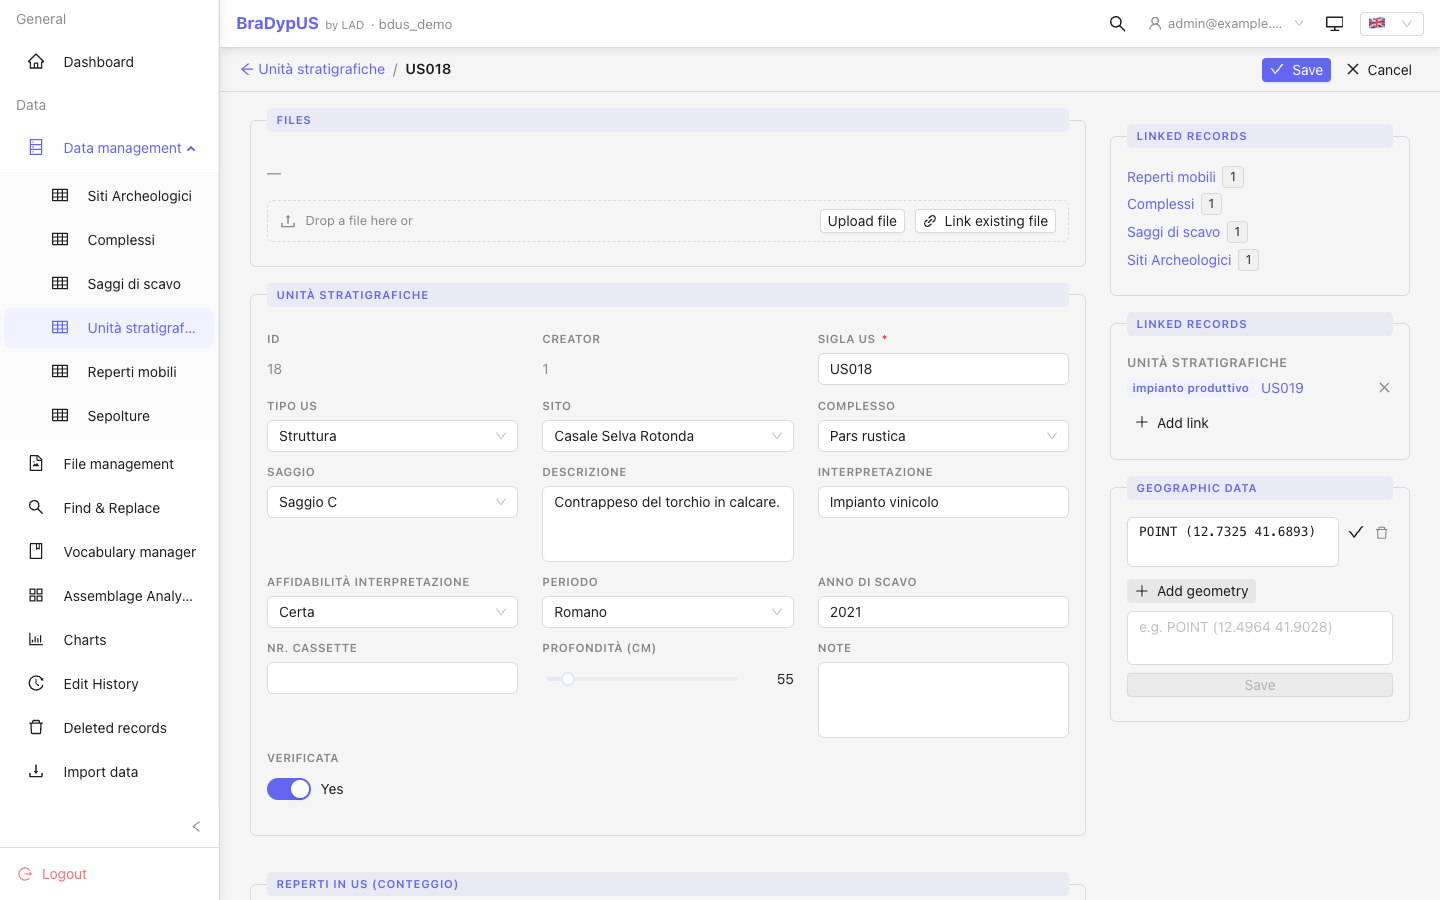
- Change a geometry — edit its WKT text. A ✓ button appears next to the field as soon as the text differs from the saved one; click it to save that geometry.
- Delete a geometry — click the trash icon next to it.
- Add a geometry — click Add geometry, paste or type a WKT string in the box that opens (a placeholder shows the expected format), then click Save. This also works for a record that has no geometry yet.
These actions are saved immediately and independently: they do not wait for the record's own Save button. If the WKT text is not valid, the change is rejected with an Invalid geometry message and nothing is stored.