
Harris Matrix (stratigraphic relations)
BraDypUS supports stratigraphic unit (US) relationship management with a built-in Harris Matrix visualisation. The feature is available for any table that has the RS plugin enabled.
Enabling the RS system
In Config → Tables → System plugins, toggle the Stratigraphic relations switch on. This enables the RS panel in RecordView and the Harris Matrix button in DataView.
The table's ID field (configured under Layout) is used as the human-readable label shown in the RS panel and the matrix. The relations are stored in the database using the integer record id as a foreign key, ensuring referential integrity.
Stratigraphic relation types
There are ten relation types organised in five inverse pairs. Relations 9 and 10 are symmetric (self-inverse).
| Code | Label | Inverse |
|---|---|---|
| 1 | Is covered by | 5 — Covers |
| 2 | Is cut by | 6 — Cuts |
| 3 | Carries | 7 — Leans against |
| 4 | Is filled by | 8 — Fills |
| 5 | Covers | 1 — Is covered by |
| 6 | Cuts | 2 — Is cut by |
| 7 | Leans against | 3 — Carries |
| 8 | Fills | 4 — Is filled by |
| 9 | Is the same as | 9 (symmetric) |
| 10 | Is bound to | 10 (symmetric) |
Directed relations (1–8) are stored as a single row with direction; you only need to enter one direction and the inverse is handled automatically. Relations 9 and 10 have no directionality.
Managing relations in RecordView
The RS panel in RecordView shows all relations for the current record.
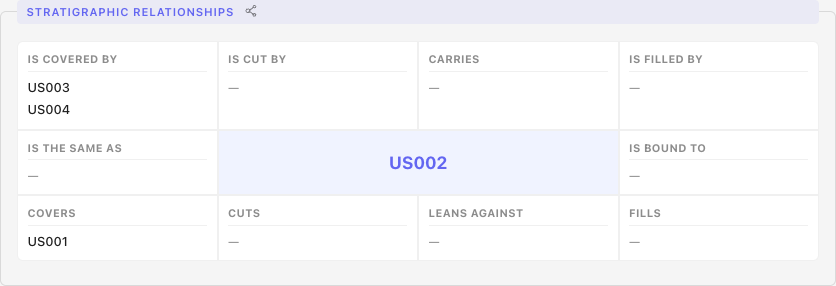
To add a relation:
- Select the relation type from the dropdown.
- Start typing in the search box to find the other unit — an autocomplete list shows matching records from the same table. Select the desired unit.
- Click Add.
To remove a relation: click the delete icon next to it.
Harris Matrix view
Click Harris Matrix in the DataView toolbar to open a full-page interactive matrix for all records in the current table (respecting the active search filter).
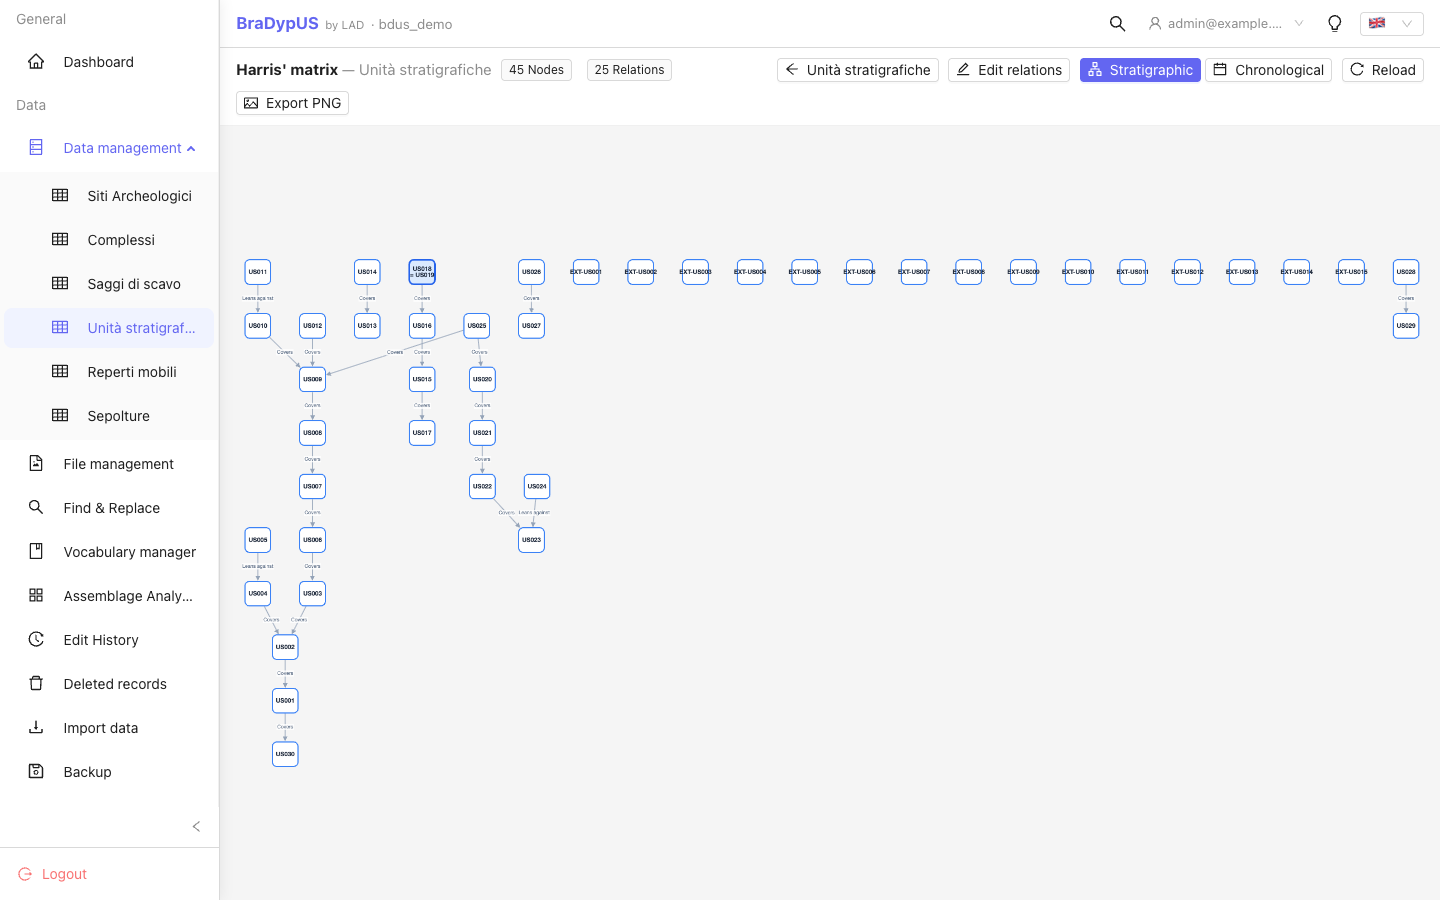
- Nodes represent individual stratigraphic units.
- Directed arrows represent the covers relationship (newer → older).
- Undirected dashed lines represent equivalences and contemporaneity.
- Units outside the active filter are shown with a dashed border.
- Click a node to navigate to that record.
Subset matrix
Apply a search filter in DataView before opening the Harris Matrix to see only the selected units. Units that are related to the filtered set but not themselves in the filter are shown in a lighter style (in-context but not in-filter).
Export
Click Export PNG in the Matrix toolbar to save the current view as a high-resolution PNG image.
Absolute chronological timeline
When the fuzzy-date plugin is active on the same table, a Chronological toggle appears in the Matrix toolbar.
| Layout | Description |
|---|---|
| Stratigraphic | Standard Harris Matrix — nodes positioned by topological depth (default). |
| Chronological | The stratigraphic layout is kept exactly as-is and only stretched or squashed vertically: the dated units are moved onto their year on the axis, and every other node keeps its stratigraphic rank, just spaced to sit between the dated units above and below it. Stratigraphic order and calendar time are both readable at once. |
In chronological mode:
- Older units appear lower on the axis; newer units appear higher.
- The vertical distance between nodes reflects the time gap between events — a long stratigraphic sequence can compress into a thin band, a short one can stretch across centuries.
- The reference year for a dated unit is the midpoint of its
chrono_from/chrono_torange (the known bound for an ante quem / post quem date). - Dated units are outlined green; every other unit is outlined amber and keeps only its topological position.
- A dated unit whose date runs against the stratigraphy (older than a unit it covers) is not pinned to the axis — it stays in its stratigraphic place so the matrix never folds. Fix the date, or the relation.
- Where several dated units fall in a very tight time span they are spread just enough to stay legible, so their axis position there is approximate.
- The SVG axis on the left shows year labels calibrated to the data range.
- Edges still connect units by their stratigraphic relationship (relation labels are hidden in this view to keep the long vertical edges readable).
- Edit mode is not available in chronological layout (read-only view).
Why is this useful?
Traditional Harris Matrix tools show which unit comes before another, but not by how much. The chronological layout reveals the real time gaps while keeping the matrix you already know.